(class)
A class representing a ring or pie in a PieChart.
Description
PieSet objects are used to define which data should be plotted, and the manner in which they should be plotted. It is designed to be subclassable, so you can create your own chart style. However, most needs should be met by the standard implementation,
StandardPieSet.
You can customize the appearance of the labels of this chart either by using
PieSet.label-factory or by setting various options. For options that should only affect the label, you can set them on
PieSet.label-group; otherwise, you can set them on the
PieSet, or even on the
PieChart or
PiePlotArea.
Likewise, you can customize the appearance of wedge shapes either by using
PieSet.shape-factory or by setting various options.
PieSet.wedge-group is the
Shape parent of wedge shapes, so you can use it for option settings that only affect the wedges.
Notes
It is common to annotate charts by adding
Shape objects to the
PieSet itself. The
PieSet's origin is the same of that as the
PiePlotArea, which is located in the center of the plot area.
PieSets clear their shape children during
PieSet.update-layout. This means that any objects added to them are removed during layout.
It is recommended that you place any chart annotations in response to
ChartLayoutChanged events. This will give you the opportunity to add in any objects that may have been removed.
The following nonlocal options apply to
PieSets in particular:
(Note that this list excludes options that may apply to children of the
PieSet; for example,
color is used by
TextShape, which means that it will affect labels.)
This object can be styled by writing style rules for "PieSet".
Example
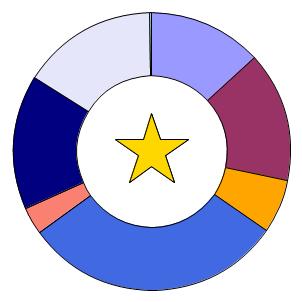
This example demonstrates the addition of a star as a decoration at the center of a chart. (
BaseScatterLayer.generate-stock-shape is used to create the star.)
| Example:
Annotating a PieSet |
 |
{import * from CURL.GUI.CHARTS}
{import * from CHARTS-DOC,
    location = "../docstring-support/gui/charts-doc.scurl"
}

{AntialiasedFrame
    {PieChart
        width = 8cm,
        height = 8cm,
        inner-radius = 2cm,
        {PieSet
            sample-records,
            "Age",
            {on ChartLayoutChanged at pie-set:PieSet do
                {pie-set.add
                    {BaseScatterLayer.generate-stock-shape
                        pie-set,
                        ScatterShape.star,
                        {Distance2d 0m, 0m},
                        2cm,
                        2cm,
                        1px,
                        LineStyle.solid,
                        "gold"
                    }
                }
            }
        }
    }
}
| |
See
PieChart for more examples, including multiple pie set examples.
| constructor protected | {PieSet.default} |
| factory public | {PieSet.default}:PieSet |
field public-get private-set PieSet.chart:#
PieChart field public constant PieSet.color-associations:{
Array-of PieColorAssociation} ={new {Array-of PieColorAssociation}}
| label-group: | A Shape that will be used as the container for all generated wedge label Shapes. |
field public constant PieSet.label-group:
Shape accessor public PieSet.label-set?:
bool setter public PieSet.label-set?:
bool | label-value?: | If true, then wedge labels (if generated) will display the value of the data at that wedge. |
accessor public PieSet.label-value?:
bool setter public PieSet.label-value?:
bool | labels: | An array containing the Shapes representing this PieSet's wedge labels. |
field public constant PieSet.labels:{
Array-of Shape} ={new {Array-of Shape}}
nonlocal option public PieSet.legend-enabled?:
bool nonlocal option public PieSet.pie-label-radius:
any nonlocal option public PieSet.pie-set-inner-margin:
any nonlocal option public PieSet.pie-set-shape-quality:
Fraction nonlocal option public PieSet.pie-set-starting-angle:
Angle nonlocal option public PieSet.pie-wedge-border-line-style:
LineStyle nonlocal option public PieSet.pie-wedge-border-width:
any accessor public PieSet.style-element:
String | wedge-group: | A Shape that will be used as the container for all generated wedge Shapes. |
field public constant PieSet.wedge-group:
Shape | wedge-labels?: | If false, then wedge labels will not be generated, regardless of other property values. |
accessor public PieSet.wedge-labels?:
bool setter public PieSet.wedge-labels?:
bool | wedges: | An array containing the Shapes representing this PieSet's wedges. |
field public constant PieSet.wedges:{
Array-of Shape} ={new {Array-of Shape}}
Properties inherited from Shape:
as-Shape, border-color, color, draw-operation, graphical-parent, option-parent, possibly-displayed?, selection-context, shape-parent, shape-selectable, stroke-thickness, transformation, visible? Properties inherited from Visual:
_style-element, clonable-class?, completely-clonable-children?, cursor, data-source, display-context, dragee, font-size, has-key-focus?, input-method-enabled?, input-method-keyboard-mode, name, options, style-class, style-manager, style-options, test-child?, test-description, test-name, test-parent?, test-type-name, test-visible?, tooltip, user-data, visual-parent
public constant PieSet.LabelFactory:
ProcType ={proc-type
{pie-set:PieSet,
set-label:#String,
data-label:#String,
value-label:#String,
position:Distance2d,
data:ChartDataSeries,
record:Record,
record-index:int,
inner-radius:Distance,
outer-radius:Distance,
total-radius:Distance,
start-angle:Angle,
stop-angle:Angle
}:Shape
}
public constant PieSet.ShapeFactory:
ProcType ={proc-type {pie-set:PieSet,
data:ChartDataSeries,
record:Record,
record-index:int,
inner-radius:Distance,
outer-radius:Distance,
start-angle:Angle,
stop-angle:Angle,
max-error:Distance,
fill-pattern:FillPattern,
border-width:any,
border-line-style:LineStyle
}:Shape
}
| public | {PieSet.default-label-factory pie-set:PieSet,set-label:#String,data-label:#String,value-label:#String,position:Distance2d,data:ChartDataSeries,record:Record,record-index:int,inner-radius:Distance,outer-radius:Distance,total-radius:Distance,start-angle:Angle,stop-angle:Angle }:Shape |
| public | {PieSet.default-shape-factory pie-set:PieSet,data:ChartDataSeries,record:Record,record-index:int,inner-radius:Distance,outer-radius:Distance,start-angle:Angle,stop-angle:Angle,max-error:Distance,fill-pattern:FillPattern,border-width:any,border-line-style:LineStyle }:Shape |
| public | {PieSet.append-color-association}:void |
| public | {PieSet.compute-data-abs-sum}:any |
| public | {PieSet.create-legend-entries}:void |
| detach: | Detach this shape from its parent. |
| public | {PieSet.detach}:void |
| draw: | Draw this object's visual representation. |
| public | {PieSet.estimate-bounds}:GRect |
| public | {PieSet.get-fill-pattern-for-record}:FillPattern |
| get-outside-margin: | Determine the amount of space required for this chart between its outer edge and the chart borders or legend. |
| public | {PieSet.get-outside-margin}:Distance |
| get-own-bounds: | Calculate the rectangular rendering bounds of this Shape, in its local coordinate system. |
| public | {PieSet.get-own-bounds dest:GRect = {GRect.empty}}:GRect |
| get-wedge-size: | Determine the ratio of a value to the sum of all values within this PieSet. |
| handle-observer-message: | This method is called by the observed object when it wants to send a message. An Observer must implement this method to perform an operation when a change occurs. |
| protected | {PieSet.handle-observer-message}:void |
| public | {PieSet.non-keyword-init-arg a:any}:void |
| public | {PieSet.note-color-associations-changed}:void |
| public | {PieSet.note-set-data-array-changed}:void |
| public | {PieSet.remove-color-association}:void |
| public | {PieSet.self-intersects-polygon?}:bool |
| public abstract | {PieSet.update-layout}:void |
Methods inherited from Shape:
apply-rotation, apply-scale, apply-transformation, apply-translation, apply-translation-in-parent, constrain-own-layout-bounds, constrain-shape-layout-bounds, contains-point?, find-graphical-ancestor, fire-crossing-event, fire-in-child, get-display-context, get-down-orientation-in-shape-parent, get-graphical-root, get-gui-path, get-gui-path-to-child, get-local-device-pixel-size, get-origin-in-graphical-ancestor, get-origin-in-root, get-origin-in-shape-parent, get-origin-in-shape-root, get-own-bounds-in-shape-root, get-own-layout-bounds, get-right-orientation-in-shape-parent, get-shape-bounds, get-shape-bounds-in-shape-root, get-shape-layout-bounds, get-top-left-in-ancestor, get-transformation-to-shape-root, keyword-init-arg, option-change-notify, overdraw-for-selection, quantize-line-thickness, request-draw, request-draw-self, reset-transformation, set-rotation, set-scale, set-transformation, set-translation-in-parent, to-Graphic, transform-from-display-coordinates, transform-from-graphical-root-coordinates, transform-point-from-shape-root, transform-point-to-shape-root, transform-to-display-coordinates, transform-to-graphical-root-coordinates, transform-vector-from-shape-root, transform-vector-to-shape-root, transformation-changed, transformation-changing Methods inherited from ShapeContainerBase:
add, clear, clone-children, draw-shape-child, draw-shape-children, get-all-children-at-point, get-child-at-point, get-leaf-at-point, get-shape-root, note-attached, note-detaching, notify-option-children, on-drag-enter, on-pointer-enter, on-pointer-envelope-event, register-options, remove, set-shape-index, set-shape-index-after, set-shape-index-before, shape-container-fire-inferior-crossing-event, shape-container-handle-crossing, shape-container-pick-child, shape-container-pointer-enter-occurred, shape-container-pointer-leave-occurred Methods inherited from Visual:
add-from-init-args, animate, change-cursor, clonable-appearance?, clone-appearance, clone-appearance-helper, find-test-children, get-focus-manager, get-layout-context, get-test-parent, get-test-property, get-text, get-view, maybe-fire-attach-event, maybe-fire-detach-event, note-caret-position, on-drag-leave, on-pointer-leave, pop-cursor, prepare-test-object, prepare-test-parent, push-cursor, quantize-width, refresh-style-options, release-key-focus, request-key-focus, scroll-to-include, test-record, test-run, xy-offset-to Methods inherited from GuiEventTarget:
handle-delegate-event, handle-event, on-action, on-cancel-mode, on-command-changed, on-commit, on-composition-change-event, on-composition-result-event, on-context-menu-event, on-current-record-change-request, on-current-record-changed, on-destroy-notify, on-destroy-requested, on-drag-over, on-drag-pointer, on-drag-started, on-drop, on-end-composition-event, on-focus-event, on-focus-in, on-focus-out, on-gesture, on-gesture-begin, on-gesture-end, on-gesture-magnify, on-gesture-pan, on-gesture-rotate, on-gesture-swipe, on-gesture-tap, on-gesture-touch, on-grab-release, on-gui-event, on-input-method-event, on-inspection, on-key-event, on-key-press, on-pointer-button, on-pointer-crossing, on-pointer-event, on-pointer-motion, on-pointer-press, on-pointer-release, on-pointer-scroll, on-raw-key-event, on-raw-key-press, on-raw-key-release, on-reset, on-selectable-added, on-selectable-removed, on-selection-changed, on-selection-context-activated, on-selection-context-deactivated, on-selection-event, on-start-composition-event, on-start-event, on-stop-event, on-view-activate, on-view-deactivate, on-window-close, remove-event-handlers-for-event-class Methods inherited from OptionListInterface:
add-option, add-style-option, change-option-parent-notify, clone-options, get-option, get-option-by-name, local-add-notify, local-remove-notify, name-to-option-key, new-option-item, option-changed, option-lookup, option-lookup-here, option-propagate-notify, option-set?, propagate-option-change, remove-option, remove-style-option, remove-styles, set-option-by-name, set-style-option-by-name, unset-option-by-name, unset-style-option-by-name
(constructor)
| protected | {PieSet.default} |
Initialize a new PieSet.
Description
This constructor is only used by subclasses, since
PieSet is an abstract class. See
PieSet.default#factory for the standard way of instantiating a
PieSet, and a discussion of the parameters taken by this constructor.
(factory)
| public | {PieSet.default}:PieSet |
Create a new PieSet.
label-data: The
ChartDataSeries, if any, to be used to provide labels. See
PieSet.label-data. If this value is
null, then no labels or legend entries can be created.
label-value?: If true, and wedge-labels? is true, then wedge labels will include the value of the data for that wedge.
label-set?: If
true, and
wedge-labels? is
true, then wedge labels will include the name of the field defining the
ChartDataSeries. This is useful for charts containing multiple pie sets.
wedge-labels?: If false, then no labels will be generated for the wedges, regardless of the values of label-value?, label-set?, and label-data.
wedge-group: A
Shape that will be used as the container for all generated wedge
Shapes. You can use this to set options that affect only the wedges. See
PieSet.wedge-group.
label-group: A
Shape that will be used as the container for all generated wedge label
Shapes. You can use this to set options that affect only the labels. See
PieSet.label-group.
border-color: A
FillPattern describing the color to be used as the border of the wedges. This value is simply used to initialize the
border-color nonlocal option.
...: The rest arguments are allowed to be
PieColorAssociations for addition to
PieSet.color-associations or any of the arguments that
Shape.default accepts, such as
EventHandlers or option initializations.
You may also use
... to initialize the data series to be plotted in one of two ways:
- You can pass a single RecordSet followed by any number of field designations from that RecordSet, either as StringInterfaces naming the field, or as RecordField objects. These will be converted into ChartDataSeries objects and added to PieSet.set-data.
- You can also pass in any number of ChartDataSeries objects for direct addition to PieSet.set-data. Note that all data series in a given PieSet must originate from the same RecordSet and use the same Domain and thus Type.
Note that all data to be plotted must be numeric.
Description
This is a factory, not a constructor, because
PieSet is an abstract class. This factory creates and returns an instance of the standard implementation,
StandardPieSet. This information should only matter to those wishing to subclass
PieSet or
StandardPieSet.
Example
(field)
public-get private-set PieSet.chart:#
PieChart The PieChart, if any, that contains this PieSet.
Description
This property is set as soon as the PieSet is added to the PieChart.
(field)
public constant PieSet.color-associations:{
Array-of PieColorAssociation} ={new {Array-of PieColorAssociation}}
Provide mappings which associate specific colors with specific Records.
Description
You can use
PieColorAssociations to override the automatic color selection process. Most applications will use
Chart.color-palette to override the color palette used for all sets. However, if for some reason you wish to control this for individual pie sets, or in a way that differs between
PieSets, then
PieSet.color-associations is the mechanism to use.
PieColorAssociations can be supplied to a
PieSet constructor; alternatively, you can use
PieSet.append-color-association,
PieSet.remove-color-association, or direct manipulation to modify associations.
Any direct manipulation of this array is allowed. However, you must call
PieSet.note-color-associations-changed whenever the array changes to ensure that the plots and related elements are regenerated.
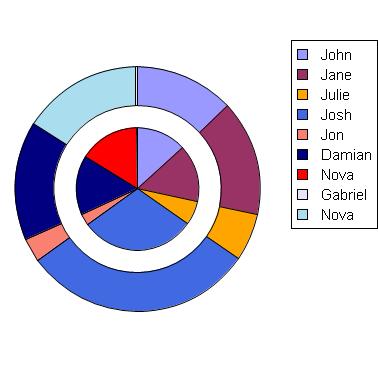
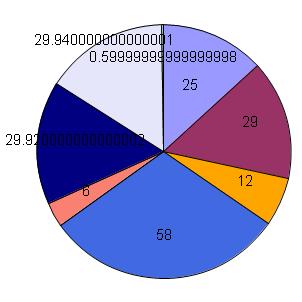
Example
Note how this example changes the color of the record for "Nova" to red for only one but not both
PieSets.
| Example:
Changing the color of a Record using PieSet.color-associations. |
 |
{import * from CURL.GUI.CHARTS}
{import * from CHARTS-DOC,
    location = "../docstring-support/gui/charts-doc.scurl"
}

{PieChart
    width = 10cm,
    height = 10cm,
    pie-set-inner-margin = 6mm,
    {PieSet
        sample-records,
        "Age",
        {PieColorAssociation
            "Name",
            "Nova",
            FillPattern.red
        },
        wedge-labels? = false,
        label-data =
            {ChartDataSeries sample-records, "Name"}
    },
    {PieSet
        sample-records,
        "Age",
        wedge-labels? = false,
        label-data =
            {ChartDataSeries sample-records, "Name"}
    }
}
| |
(accessor)
A ChartDataSeries used to define the data used to label wedges and make legend entries.
Description
Without specified
label-data, a
PieSet cannot create labels or legend entries, because it has no way of determining which field should be used.
This data series need not come from the same
RecordSet as the elements in
PieSet.set-data, but every
Record in
PieSet.set-data must have the
RecordField referred to in
label-data.
Example
(accessor)
A factory procedure used to generate each wedge label Shape in this PieSet.
Description
You can supply your own procedure to modify the generation of labels in this
PieSet. This procedure will be called many times for each pie set; it will be called once per record in each data series in
PieSet.set-data. See
PieSet.ShapeFactory for a discussion of the procedure's arguments.
Changing the shape factory is the preferred method of modifying the appearance of a chart when option settings are not sufficient. Changing the shape factory is far preferable to modifying the contents of
PieSet.wedges, for instance; the contents of
PieSet.wedges may be regenerated at any time, and you would need to reapply any modifications when this occurred. (You could do so in response to
ChartLayoutChanged events if you wished to do so.)
Note that this factory will not be called if
PieSet.wedge-labels? is
false. Depending upon the values of
PieSet.label-set?,
PieSet.label-data, and
PieSet.label-value?,
set-label,
data-label, and
value-label may each be
null. In fact, they may all be
null. If you wish to display no label, simply return an empty
ShapeGroup.
The default label factory is
PieSet.default-label-factory. A common technique is to define your factory procedure to call the default factory and then modify the result. For instance, you could modify options such as
Visual.tooltip.
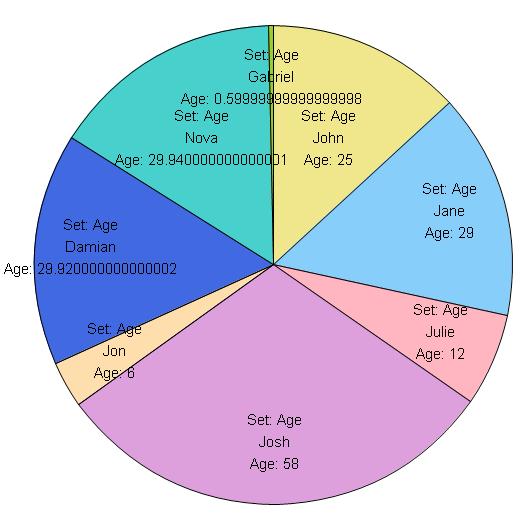
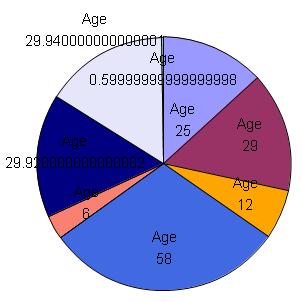
Example
This example uses
PieSet.label-factory to modify the label
Strings before calling the default factory.
| Example:
Using PieSet.label-factory |
 |
{import * from CURL.GUI.CHARTS}
{import * from CHARTS-DOC,
    location = "../docstring-support/gui/charts-doc.scurl"
}

{PieChart
    width = 14cm,
    height = 14cm,
    legend-enabled? = false,
    pie-label-radius = -1.5cm,
    color-palette = pastel-chart-color-palette,
    {PieSet
        sample-records,
        "Age",
        label-set? = true,
        label-value? = true,
        label-data =
            {ChartDataSeries sample-records, "Name"},
        label-group = {ShapeGroup color = "black"},
        label-factory =
            {proc {pie-set:PieSet,
                   set-label:#String,
                   data-label:#String,
                   value-label:#String,
                   position:Distance2d,
                   data:ChartDataSeries,
                   record:Record,
                   record-index:int,
                   inner-radius:Distance,
                   outer-radius:Distance,
                   total-radius:Distance,
                   start-angle:Angle,
                   stop-angle:Angle
                  }:Shape

                {if-non-null l = set-label then
                    set set-label = "Set: " & l
                }
                {if-non-null l = value-label then
                    set value-label = data.field.caption & ": " & l
                }
                {return
                    {PieSet.default-label-factory
                        pie-set,
                        set-label,
                        data-label,
                        value-label,
                        position,
                        data,
                        record,
                        record-index,
                        inner-radius,
                        outer-radius,
                        total-radius,
                        start-angle,
                        stop-angle
                    }
                }
            }
    }
}
| |
(field)
public constant PieSet.label-group:
Shape A Shape that will be used as the container for all generated wedge label Shapes.
Description
You can use this object to set options that affect only the labels. You can pass your own
Shape for this value to the
PieSet.default#factory factory.
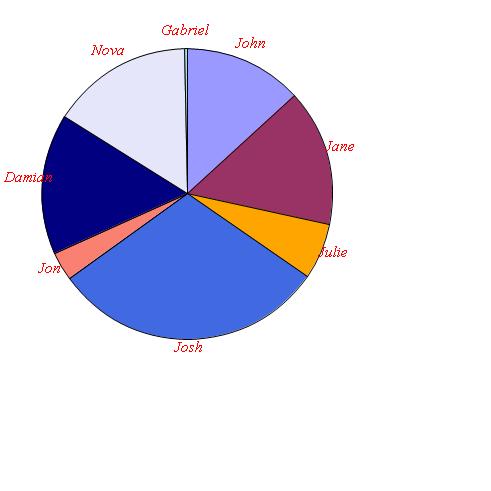
Example
| Example:
Using PieSet.label-group to modify label appearance using options |
 |
{import * from CURL.GUI.CHARTS}
{import * from CHARTS-DOC,
    location = "../docstring-support/gui/charts-doc.scurl"
}

{Canvas
    width = 13cm,
    height = 13cm,
    {PieChart
        width = 10cm,
        height = 10cm,
        {PieSet
            sample-records,
            "Age",
            label-data =
                {ChartDataSeries sample-records, "Name"},
            label-group =
                {ShapeGroup
                    color = FillPattern.red,
                    font-family = "serif",
                    font-style = FontStyle.italic
                }
        }
    }
}
| |
(accessor)
accessor public PieSet.label-set?:
bool setter public PieSet.label-set?:
bool If true, then wedge labels (if generated) will include the RecordField.caption value or values of the data being charted.
Notes
If
PieSet.wedge-labels? is
false, then wedge labels will not be created, regardless of the value of this property.
Example
| Example:
Using PieSet.label-set? |
 |
{import * from CURL.GUI.CHARTS}
{import * from CHARTS-DOC,
    location = "../docstring-support/gui/charts-doc.scurl"
}

{PieChart
    width = 8cm,
    height = 8cm,
    pie-label-radius = -1cm,
    {PieSet
        sample-records,
        "Age",
        label-value? = true,
        label-set? = true
    }
}
| |
(accessor)
accessor public PieSet.label-value?:
bool setter public PieSet.label-value?:
bool If true, then wedge labels (if generated) will display the value of the data at that wedge.
Notes
If
PieSet.wedge-labels? is
false, then wedge labels will not be created, regardless of the value of this property.
Example
| Example:
Using PieSet.label-value? |
 |
{import * from CURL.GUI.CHARTS}
{import * from CHARTS-DOC,
    location = "../docstring-support/gui/charts-doc.scurl"
}

{PieChart
    width = 8cm,
    height = 8cm,
    pie-label-radius = -1cm,
    {PieSet
        sample-records,
        "Age",
        label-value? = true
    }
}
| |
(field)
public constant PieSet.labels:{
Array-of Shape} ={new {Array-of Shape}}
An array containing the Shapes representing this PieSet's wedge labels.
Description
This array will either be empty (if there are no wedge labels), or contain one element for each
Record contained in the data series in
PieSet.set-data. These are the
Shapes returned by
PieSet.label-factory.
This array is intended for inspection only, not modification. Don't reorder it or add or remove elements. Also, its contents change each time chart layout occurs. As such, its contents will only be valid after layout occurs. You may wish to use an
EventHandler for
ChartLayoutChanged to receive notification of when these values change.
Modification of the
Shape objects within this array is allowed. However, it is generally far easier to accomplish the same things by supplying a factory procedure to
PieSet.shape-factory. This is the recommended technique, since it does not require you to be concerned about when layout has changed and when the shapes require updating.
(nonlocal option)
public PieSet.legend-enabled?:
bool A bool that can be used to enable or disable legend creation for a Chart.
Description
This option is usually set on the chart itself. However, its meaning is interpreted by individual
ChartLayers or
PieSets, which means that you can enable or disable generation of legend entries for each individual layer or set. Note that if it is set to
false at the
Chart, then no legend will be included in the chart, regardless of the value at any layer or set.
See
Chart.create-legend for an example of using this option to inhibit legend creation while placing the legend into an external graphical container.
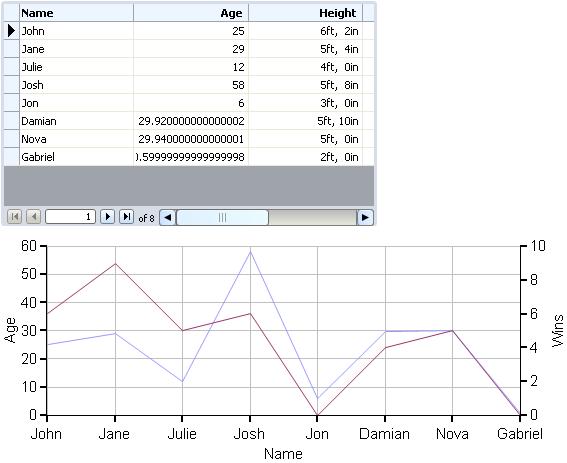
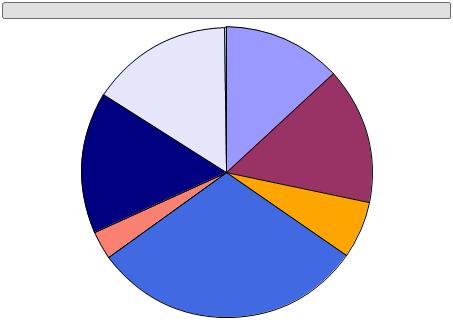
Example
Try moving the
legend-enabled? definition into one of the
LineLayer definitions instead, and see how it only affects the legend.
| Example:
Using legend-enabled? |
 |
{import * from CURL.GUI.CHARTS}
{import * from CHARTS-DOC,
    location = "../docstring-support/gui/charts-doc.scurl"
}

{RecordGrid height = 6cm, record-source = sample-records}

{LayeredChart
    width = 15cm,
    height = 6cm,
    || Try moving this into one of the LineLayer definitions:
    legend-enabled? = false,
    group-y-axis-data-across-layers? = true,
    {LineLayer
        {ChartDataSeries sample-records, "Age"},
        x-axis-data = {ChartDataSeries sample-records, "Name"}
    },
    {LineLayer
        {ChartDataSeries sample-records, "Wins"}
    }
}
| |
(nonlocal option)
The factory procedure used to generate individual legend entries for a Chart's legend.
Description
(nonlocal option)
public PieSet.pie-label-radius:
any The radius at which labels should be placed within a PieSet.
Description
(nonlocal option)
public PieSet.pie-set-inner-margin:
any
(nonlocal option)
public PieSet.pie-set-shape-quality:
Fraction The quality required when creating the wedge shapes for a PieSet.
Description
(nonlocal option)
public PieSet.pie-set-starting-angle:
Angle
(nonlocal option)
public PieSet.pie-wedge-border-line-style:
LineStyle
(nonlocal option)
public PieSet.pie-wedge-border-width:
any The border width to be applied to Shapes generated within a PieSet.
Description
(field)
The ChartDataSeries to be plotted by this PieSet.
Description
Notes
Multiple data series may be plotted. Each data series is essentially appended to the rest; if the data series have a total of ten
Records, then there will be ten pie wedges.
Note that all data series to be plotted within a single
PieSet must originate in the same
RecordSet, and must share the same
Domain and thus the same
Type. Also, all data to be plotted must be numeric.
(accessor)
A factory procedure used to generate each wedge Shape in this PieSet.
Description
You can supply your own procedure to modify the manner in which charting occurs. This procedure will be called many times for each pie set; it will be called once per record in each data series in
PieSet.set-data. See
PieSet.ShapeFactory for a discussion of the procedure's arguments.
Changing the shape factory is the preferred method of modifying the appearance of a chart when option settings are not sufficient. Changing the shape factory is far preferable to modifying the contents of
PieSet.wedges, for instance; the contents of
PieSet.wedges may be regenerated at any time, and you would need to reapply any modifications when this occurred. (You could do so in response to
ChartLayoutChanged events if you wished to do so.)
The default shape factory is
PieSet.default-shape-factory. A common technique is to define your factory procedure to call the default factory and then modify the result. For instance, you could modify options such as
Visual.tooltip. It is not recommended to use this technique to change the color of the series, however, because this change will not show up in the chart's legend. Instead, you should use
Chart.color-palette or
PieSet.color-associations.
Example
This example makes use of
PieSet.shape-factory to add tooltips to the
Shapes. It uses
PieSet.default-shape-factory to do the work of generating the
Shape.
| Example:
Using PieSet.shape-factory for tooltips |
 |
{import * from CURL.GUI.CHARTS}
{import * from CHARTS-DOC,
    location = "../docstring-support/gui/charts-doc.scurl"
}

{PieChart
    width = 10cm,
    height = 10cm,
    {PieSet
        sample-records,
        "Age",
        shape-factory =
            {proc {pie-set:PieSet,
                   data:ChartDataSeries,
                   record:Record,
                   record-index:int,
                   inner-radius:Distance,
                   outer-radius:Distance,
                   start-angle:Angle,
                   stop-angle:Angle,
                   max-error:Distance,
                   fill-pattern:FillPattern,
                   border-width:any,
                   border-line-style:LineStyle
                  }:Shape

                let shape:Shape =
                    {PieSet.default-shape-factory
                        pie-set,
                        data,
                        record,
                        record-index,
                        inner-radius,
                        outer-radius,
                        start-angle,
                        stop-angle,
                        max-error,
                        fill-pattern,
                        border-width,
                        border-line-style
                    }
                set shape.tooltip =
                    {Tooltip
                        {format "%s: %s years old",
                            record["Name"],
                            record["Age"]
                        },
                        style = TooltipStyle.immediate
                    }
                {return shape}
            }
    }
}
| |
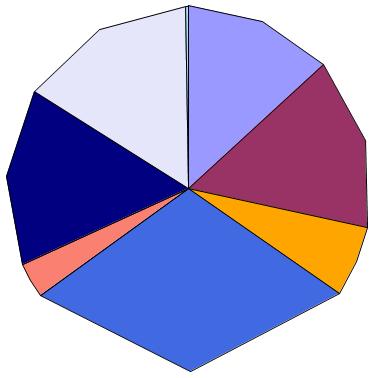
This more advanced example uses
PieSet.shape-factory to completely replace the normal wedge
Shape with a chunky-looking polygon.
| Example:
Using PieSet.shape-factory to generate different Shapes |
 |
{import * from CURL.GUI.CHARTS}
{import * from CHARTS-DOC,
    location = "../docstring-support/gui/charts-doc.scurl"
}

{PieChart
    width = 10cm,
    height = 10cm,
    {PieSet
        sample-records,
        "Age",
        shape-factory =
            {proc {pie-set:PieSet,
                   data:ChartDataSeries,
                   record:Record,
                   record-index:int,
                   inner-radius:Distance,
                   outer-radius:Distance,
                   start-angle:Angle,
                   stop-angle:Angle,
                   max-error:Distance,
                   fill-pattern:FillPattern,
                   border-width:any,
                   border-line-style:LineStyle
                  }:Shape
                || Generate chunky 5-sided polygons instead of wedges.

                let constant inner-point-0:Distance2d =
                    {Distance2d
                        {cos start-angle} * inner-radius,
                        {sin start-angle} * inner-radius
                    }
                let constant inner-point-1:Distance2d =
                    {Distance2d
                        {cos stop-angle} * inner-radius,
                        {sin stop-angle} * inner-radius
                    }
                let constant outer-point-0:Distance2d =
                    {Distance2d
                        {cos start-angle} * outer-radius,
                        {sin start-angle} * outer-radius
                    }
                let constant middle-angle:Angle =
                    0.5 * (start-angle + stop-angle)
                let constant outer-point-1:Distance2d =
                    {Distance2d
                        {cos middle-angle} * outer-radius,
                        {sin middle-angle} * outer-radius
                    }
                let constant outer-point-2:Distance2d =
                    {Distance2d
                        {cos stop-angle} * outer-radius,
                        {sin stop-angle} * outer-radius
                    }
                {return
                    {RegionShape
                        {Region.from-vertices
                            inner-point-0,
                            inner-point-1,
                            outer-point-2,
                            outer-point-1,
                            outer-point-0
                        },
                        color = fill-pattern,
                        border-width = border-width,
                        border-line-style = border-line-style
                    }
                }
            }
    }
}
| |
(accessor)
accessor public PieSet.style-element:
String The "element" or "type" of this Visual, for the purpose of styling.
Description
This implementation returns the value of
Visual._style-element but is normally overridden to return a constant value.
Overriding
If a subclass of
Visual should be stylable separately from other types of objects, this getter should be overridden to return an appropriate string. By convention, this string is the name of the class or the name of the markup that produces the object.
An override must return
self._style-element if it is not the empty string.
Introduced in:
version 6.0
(field)
public constant PieSet.wedge-group:
Shape A Shape that will be used as the container for all generated wedge Shapes.
Description
You can use this object to set options that affect only the wedges. You can pass your own
Shape for this value to the
PieSet.default#factory factory.
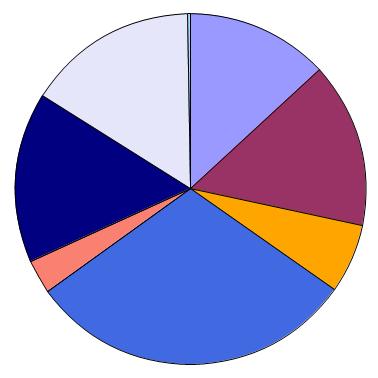
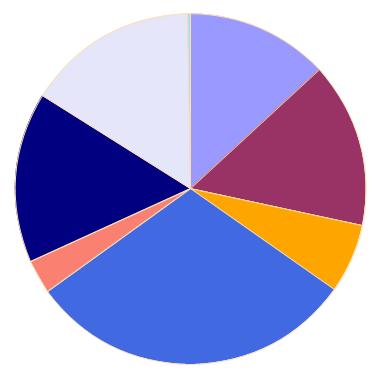
Example
| Example:
Using PieSet.wedge-group to modify wedge appearance using options |
 |
{import * from CURL.GUI.CHARTS}
{import * from CHARTS-DOC,
    location = "../docstring-support/gui/charts-doc.scurl"
}

{PieChart
    width = 10cm,
    height = 10cm,
    {PieSet
        sample-records,
        "Age",
        wedge-group =
            {ShapeGroup
                border-color = "navajowhite"
            }
    }
}
| |
(accessor)
accessor public PieSet.wedge-labels?:
bool setter public PieSet.wedge-labels?:
bool If false, then wedge labels will not be generated, regardless of other property values.
Notes
This can be useful in some cases to inhibit overall label generation. For example, if you specify
PieSet.label-data, then labels will always be generated, unless this parameter is
false. However, if you omit
PieSet.label-data to remove the labels, then you will also lose the ability to display a legend. To display a legend without creating wedge labels, use this property.
Example
| Example:
Using PieSet.wedge-labels? |
 |
{import * from CURL.GUI.CHARTS}
{import * from CHARTS-DOC,
    location = "../docstring-support/gui/charts-doc.scurl"
}

{PieChart
    width = 8cm,
    height = 8cm,
    pie-label-radius = -1cm,
    {PieSet
        sample-records,
        "Age",
        label-value? = true,
        label-set? = true
    }
}
| |
(field)
public constant PieSet.wedges:{
Array-of Shape} ={new {Array-of Shape}}
An array containing the Shapes representing this PieSet's wedges.
Description
This array will contain one element for each
Record contained in the data series in
PieSet.set-data. These are the
Shapes returned by
PieSet.shape-factory.
This array is intended for inspection only, not modification. Don't reorder it or add or remove elements. Also, its contents change each time chart layout occurs. As such, its contents will only be valid after layout occurs. You may wish to use an
EventHandler for
ChartLayoutChanged to receive notification of when these values change.
Modification of the
Shape objects within this array is allowed. However, it is generally far easier to accomplish the same things by supplying a factory procedure to
PieSet.shape-factory. This is the recommended technique, since it does not require you to be concerned about when layout has changed and when the shapes require updating.
(class constant)
public constant PieSet.LabelFactory:
ProcType ={proc-type
{pie-set:PieSet,
set-label:#String,
data-label:#String,
value-label:#String,
position:Distance2d,
data:ChartDataSeries,
record:Record,
record-index:int,
inner-radius:Distance,
outer-radius:Distance,
total-radius:Distance,
start-angle:Angle,
stop-angle:Angle
}:Shape
}
The Type of factory procedure used for the generation of PieSet Shape elements for each wedge label. This is the type of the option PieSet.label-factory.
pie-set: The
PieSet for which
Shape generation is being performed.
set-label: The label to be used to represent this data set. This will only be non-null if
PieSet.label-set? is
true.
data-label: The label to be used to represent this data set. This will only be non-null if
PieSet.label-data is non-null.
value-label: The label to be used to represent this data set. This will only be non-null if
PieSet.label-value? is
true.
position: The position at which the label is to be placed.
record: The
Record corresponding to this particular call to the
LabelFactory.
record-index: The index of
record, counting from the beginning of its
RecordSet.
inner-radius: The radius, measured from the origin, at which the wedge for this record begins.
outer-radius: The radius, measured from the origin, at which the wedge for this record ends.
total-radius: The total radius of the entire pie chart, including all PieSets.
start-angle: The
Angle at which the wedge for this record begins.
stop-angle: The
Angle at which the wedge for this record ends.
Returns
A
Shape to be added to the pie set.
Description
(class constant)
public constant PieSet.ShapeFactory:
ProcType ={proc-type {pie-set:PieSet,
data:ChartDataSeries,
record:Record,
record-index:int,
inner-radius:Distance,
outer-radius:Distance,
start-angle:Angle,
stop-angle:Angle,
max-error:Distance,
fill-pattern:FillPattern,
border-width:any,
border-line-style:LineStyle
}:Shape
}
The Type of factory procedure used for the generation of PieSet Shape elements for each wedge. This is the type of the option PieSet.shape-factory.
pie-set: The
PieSet for which
Shape generation is being performed.
record: The
Record corresponding to this particular call to the
ShapeFactory.
record-index: The index of
record, counting from the beginning of its
RecordSet.
inner-radius: The radius, measured from the origin, at which the wedge should begin.
outer-radius: The radius, measured from the origin, at which the wedge should end.
start-angle: The
Angle at which the wedge should begin.
stop-angle: The
Angle at which the wedge should end.
max-error: A maximum error measurement calculated based on
pie-set-shape-quality. If you are implementing your own
Shape generation logic, you can safely ignore this parameter.
fill-pattern-for-series: The
FillPattern in which the
Shape should be created.
Returns
A
Shape to be added to the
PieSet.
Description
(class proc)
| public | {PieSet.default-label-factory pie-set:PieSet,set-label:#String,data-label:#String,value-label:#String,position:Distance2d,data:ChartDataSeries,record:Record,record-index:int,inner-radius:Distance,outer-radius:Distance,total-radius:Distance,start-angle:Angle,stop-angle:Angle }:Shape |
The default value of PieSet.label-factory.
pie-set: The
PieSet for which
Shape generation is being performed.
set-label: The label to be used to represent this data set. This will only be non-null if
PieSet.label-set? is
true.
data-label: The label to be used to represent this data set. This will only be non-null if
PieSet.label-data is non-null.
value-label: The label to be used to represent this data set. This will only be non-null if
PieSet.label-value? is
true.
position: The position at which the label is to be placed.
record: The
Record corresponding to this particular call to the
LabelFactory.
record-index: The index of
record, counting from the beginning of its
RecordSet.
inner-radius: The radius, measured from the origin, at which the wedge for this record begins.
outer-radius: The radius, measured from the origin, at which the wedge for this record ends.
total-radius: The total radius of the entire pie chart, including all PieSets.
start-angle: The
Angle at which the wedge for this record begins.
stop-angle: The
Angle at which the wedge for this record ends.
Returns
A
Shape to be added to the pie set.
Description
This procedure creates a
TextShape for each non-null label. If necessary, it puts them in a
ShapeGroup, offsetting each a sufficient distance to prevent overlap.
See
PieSet.label-factory for more information and an example of the usage of this type.
(class proc)
| public | {PieSet.default-shape-factory pie-set:PieSet,data:ChartDataSeries,record:Record,record-index:int,inner-radius:Distance,outer-radius:Distance,start-angle:Angle,stop-angle:Angle,max-error:Distance,fill-pattern:FillPattern,border-width:any,border-line-style:LineStyle }:Shape |
The default value of PieSet.shape-factory.
pie-set: The
PieSet for which
Shape generation is being performed.
record: The
Record corresponding to this particular call to the
ShapeFactory.
record-index: The index of
record, counting from the beginning of its
RecordSet.
inner-radius: The radius, measured from the origin, at which the wedge should begin.
outer-radius: The radius, measured from the origin, at which the wedge should end.
start-angle: The
Angle at which the wedge should begin.
stop-angle: The
Angle at which the wedge should end.
fill-pattern-for-series: The
FillPattern in which the
Shape should be created.
Returns
A
Shape to be added to the
PieSet.
Description
This procedure uses its parameters to generate a polygon of the appropriate shape, converting that into a
Region and returning a
RegionShape for this
Region.
See
PieSet.shape-factory for more information and an example of the usage of this procedure.
(method)
| public | {PieSet.append-color-association}:void |
(method)
Add a ChartDataSeries to PieSet.set-data to be charted.
data: The ChartDataSeries to be added.
Description
(method)
| public | {PieSet.compute-data-abs-sum}:any |
Compute the sum of the absolute values of the data in this PieSet.
Returns
Description
This value is used to determine the proportion of the whole each data point represents.
(method)
| public | {PieSet.create-legend-entries}:void |
Create the legend entries required for this PieSet.
container: An array to which any created entries should be appended.
entries-already-created: A
PieLegendKeySet used to keep track of which legend entries have already been created. If an entry is already present for a
Record,
RecordField, and
FillPattern, then this method will not create them again. If it does create them, it will add them to the set.
Description
It may be useful to override this method to influence legend generation. However, it is simpler and more common to use
PieSet.legend-entry-factory to supply a factory procedure. This factory procedure will be called by
PieSet.create-legend-entries for each legend entry not already present.
Notes
No legend entries can be created unless data is associated with labels. See
PieSet.label-data.
(method)
| public | {PieSet.detach}:void |
Detach this shape from its parent.
Description
This is semantically equivalent to calling
ShapeContainerBase.remove on this shape's parent.
Calling
detach on a shape with no parent has no effect.
(method)
Draw this object's visual representation.
renderer2d: The
Renderer2d that this object should use to draw itself.
Overriding
When subclassing Shape, this method must be overridden.
(method)
| public | {PieSet.estimate-bounds}:GRect |
Estimate the bounds required by this PieSet.
inner-radius: The inner radius of this PieSet.
outer-radius: The outer radius of this PieSet.
total-radius: The total radius all PieSets.
dest: An optional GRect object to be used to return the data.
Returns
A
GRect object containing the bounds. This will always be the same object as
dest. This
GRect must be well-formed; that is, the following must be true:
-dest.lextent <= dest.rextent and -dest.ascent <= dest.descentDescription
This is called from
PieChart.estimate-margins.
PieSet implementations must perform whatever operations are necessary to estimate their bounds. Usually this will involve generation of at least some labels to determine their bounds.
The returned
GRect need not be strictly correct; however, it will be used to determine how much space is allocated for the pie sets and labels, and so any errors may result in too much or too little space being allocated to the plot area and labels.
Notes
The default implementation simply performs full layout via
PieSet.update-layout. Implementations are encouraged to optimize this by performing fewer operations.
StandardPieSet implements such optimizations, so this is only of concern to you if you are subclassing
PieSet.
(method)
Determine the ChartDataSeries, if any, associated with a Shape.
shape: The Shape to look up.
Description
If
Shape was generated by this
PieSet to represent an element of
PieSet.set-data, then this method will determine which element it was and return that data series. Otherwise, it will return null.
If you are subclassing
PieSet, you must implement this method. This is usually done by keeping track of the set of generated
Shapes and determining whether the
Shape passed in is a member of the known
Shapes.
(method)
| public | {PieSet.get-fill-pattern-for-record}:FillPattern |
Get a FillPattern for use in charting one of the Records of this PieSet.
record: The
Record to be charted.
record-index: The index of
record, counting from the beginning of its
RecordSet.
Returns
The FillPattern to be used.
Description
This method interacts with
PieSet.color-associations and the
PieChart to determine the appropriate color for this data series. It is used by
PieSet implementations and legend factories to determine the color to use with each
Record.
(method)
Calculate the position for a wedge label.
record: The
Record corresponding to this particular call to the
LabelFactory.
record-index: The index of
record, counting from the beginning of its
RecordSet.
inner-radius: The radius, measured from the origin, at which the wedge for this record begins.
outer-radius: The radius, measured from the origin, at which the wedge for this record ends.
total-radius: The total radius of the entire pie chart, including all PieSets.
start-angle: The
Angle at which the wedge for this record begins.
stop-angle: The
Angle at which the wedge for this record ends.
Returns
A point in the coordinate system of this PieSet.
(method)
| public | {PieSet.get-outside-margin}:Distance |
Determine the amount of space required for this chart between its outer edge and the chart borders or legend.
Description
The standard implementation of this method requires enough space to accommodate the border of the wedges. You can override this method if you require more space.
(method)
| public | {PieSet.get-own-bounds dest:GRect = {GRect.empty}}:GRect |
Calculate the rectangular rendering bounds of this Shape, in its local coordinate system.
dest: An optional GRect object to be used to return the data.
Returns
A
GRect object containing the bounds. This will always be the same object as
dest. This
GRect must be well-formed; that is, the following must be true:
-dest.lextent <= dest.rextent and -dest.ascent <= dest.descentDescription
The bounds returned should cover all pixels that will be painted by this object but do not include all of the children of this object.
Notes
Rendering bounds (
get-own-bounds) and layout bounds (
get-own-layout-bounds) are typically similar, but may differ. In particular, the rendering bounds may be generously inclusive, but the layout bounds must describe the
Shape precisely in order for adjacent items to abut properly.
Overriding
When subclassing Shape, this method must be overridden. The dest parameter must be used to return the data.
(method)
Find the Record, ChartDataSeries, and Shape at the given point, if any.
x: The X coordinate, relative to this PieSet.
y: The Y coordinate, relative to this PieSet.
Returns
The Record, ChartDataSeries, and Shape at the point. If no data series has placed a Shape at this position, then all values will be null; otherwise, they will all be non-null.
Description
The point passed in should be relative to this
PieSet's coordinate system. Unless you have modified the
Shape.transformation of this
PieSet, the origin of the
PieSet is at the center of the plot area. See below for an example involving conversion of
Chart-relative coordinates to plot-area-relative coordinates.
One possible alternative to this method would be to override
Shape generation using
PieSet.shape-factory to place whatever data you require into the
Visual.user-data option on each shape. Then, retrieving this data at a given point would be as simple as calling
ShapeContainerBase.get-child-at-point and examining the
user-data value of the returned
Shape.
Notes
For other techniques related to this one, see:
Example
Move the mouse pointer over the wedges in this pie chart to see information about each of them. This information is discovered at run-time using
PieSet.get-record-at-point.
| Example:
Using PieSet.get-record-at-point |
 |
{import * from CURL.GUI.CHARTS}
{import * from CHARTS-DOC,
    location = "../docstring-support/gui/charts-doc.scurl"
}

{let display:TextDisplay = {TextDisplay}}

{VBox
    hstretch? = true,
    display,
    {PieChart
        width = 12cm,
        height = 8cm,
        {PieSet
            sample-records,
            "Age"
        },
        {on e:PointerMotion at chart:PieChart do
            || Transform coordinates from chart into one of its
            || children -- the plot area:
            let constant point-in-plot-area:Distance2d =
                {chart.plot-area.transformation.inverse-transform-point
                    {Distance2d e.x, e.y}
                }

            let constant pie-set:PieSet = chart.sets[0]
            let (record:#Record, data:#ChartDataSeries, shape:#Shape) =
                {pie-set.get-record-at-point
                    point-in-plot-area.x,
                    point-in-plot-area.y
                }

            set display.value =
                {if-non-null record then
                    {format
                        "Name: %s, points: %s, wins: %s, age: %s   " &
                        "(from series %s)",
                        record["Name"],
                        record["Points"],
                        record["Wins"],
                        record["Age"],
                        data.field.caption
                    }
                 else
                    ""
                }
        }
    }
}
| |
(method)
Determine the ratio of a value to the sum of all values within this PieSet.
Returns
(method)
| protected | {PieSet.handle-observer-message}:void |
This method is called by the observed object when it wants to send a message. An Observer must implement this method to perform an operation when a change occurs.
sender: the Observable object that's changed
message: This contains more detailed information about the change from the Observer. If no more information is present, then this is null.
(method)
| public | {PieSet.non-keyword-init-arg a:any}:void |
Invoked when InitRestArgParser.process-rest-args encounters a non-keyword argument.
Description
Visual's implementation of this method will first attempt to interpret the input to this method as meta-data to be associated with the object. For example,
EventHandlers and
DataBindings to be associated with the object are recognized and the appropriate steps are taken to attach them to the object.
Any input that cannot be understood as meta-data is assumed to be contents to be added to the
Visual and passed to
Visual.add-from-init-args.
Overriding
Override this method to accept additional meta-data associated with the object. Implementations should typically invoke the super implementation on inputs that they fail to interpret.
(method)
| public | {PieSet.note-color-associations-changed}:void |
Notify this PieSet that the contents of PieSet.color-associations have changed.
Description
Direct manipulation of PieSet.color-associations in any manner desired is allowed. You must simply call this method whenever its content changes.
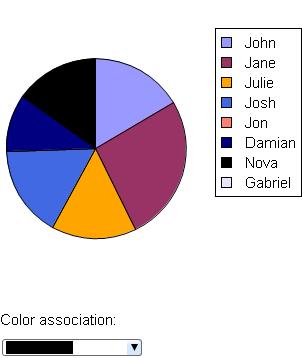
Example
This example demonstrates use of a
Pixmap as a color for charting in addition to demonstrating the use of
PieSet.note-color-associations-changed.
| Example:
Changing a color association in a PieSet at run-time |
 |
{import * from CURL.GUI.CHARTS}
{import * from CURL.GRAPHICS.IMAGEFILTER}
{import * from CHARTS-DOC,
    location = "../docstring-support/gui/charts-doc.scurl"
}

{let chart:PieChart =
    {PieChart
        width = 8cm,
        height = 8cm,
        {PieSet
            sample-records,
            "Points",
            {PieColorAssociation
                "Name",
                "Nova",
                FillPattern.black
            },
            wedge-labels? = false,
            label-data = {ChartDataSeries sample-records, "Name"}
        }
    }
}

{value chart}

|| Scale the pixmap to a reasonable size:
{let constant pixmap:Pixmap =
    {filter-pixmap
        scale,
        {Pixmap.from-url
            {url "curl://install/docs/default/images/curtain.jpg"}
        },
        scale = 25%,
        filter-mode = "linear"
    }
}

Color association:

{DropdownList
    "black",
    "steelblue",
    "purple",
    "orange",
    pixmap,
    list-item-creation-proc =
        {proc {val:any}:ListItem
            {return
                {ListValueItem
                    value = val,
                    {type-switch val
                     case p:Pixmap do
                        {RectangleGraphic
                            fill-color = val,
                            width = p.width * 1px,
                            height = p.height * 1px
                        }
                     else
                        {RectangleGraphic
                            fill-color = val,
                            width = 50pt,
                            height = 10pt
                        }
                    }
                }
            }
        },
    {on ValueChanged at ddl:DropdownList do
        let constant s:PieSet = chart.sets[0]
        set s.color-associations[0] =
            {PieColorAssociation
                "Name",
                "Nova",
                ddl.value asa FillPattern
            }
        {s.note-color-associations-changed}
    },
    value="black"
}
| |
(method)
| public | {PieSet.note-set-data-array-changed}:void |
Notify this PieSet that the order of PieSet.set-data has changed.
Description
PieSet.set-data may be manipulated directly only to change the order of existing elements. When you do this, you must call this method to give the PieSet a chance to regenerate its elements.
(method)
| public | {PieSet.remove-color-association}:void |
(method)
Remove a ChartDataSeries from PieSet.set-data.
data: The ChartDataSeries to be removed. This object must be a member of PieSet.set-data, or an error will occur.
Description
(method)
Determine whether or not a point lies within this Shape.
x: The X coordinate of the point.
y: The Y coordinate of the point.
Returns
true if this Shape contains (x, y).
Description
The point is in this object's local coordinate system. This method does not consider its children.
Overriding
When subclassing
Shape, this method must be overridden. This method determines when mouse events (such as
PointerMotion) will be delivered to this object, among other things.
Generally, you should implement this method to determine whether or not the point lies within any of the rendered primitives of the shape, not simply whether or not it is within the bounds of the shape. However, you are free to implement it using whatever metric you desire.
(method)
| public | {PieSet.self-intersects-polygon?}:bool |
Determine whether a polygon intersects this Shape.
polygon: An object containing set of points that describe a polygon in this shape's local coordinate space. It is guaranteed that this polygon will be convex and will use a counter-clockwise winding order.
Description
This method is very similar to
Shape.self-contains-point?, except that it deals with an area rather than a point. It is primarily used to support area-based selection, but it may also be directly called.
Overriding
When subclassing
Shape, this method must be overridden. It need not consider children.
Generally, you should implement this method to determine whether or not the area intersects with any of the rendered primitives of the shape, not simply whether or not it is within the bounds of the shape. However, you are free to implement it using whatever metric you desire. Users will experience strange results when selecting this object if the implementation of this method disagrees with
Shape.self-contains-point?.
If you are not using any selection features, this method can be implemented to simply return false.
(method)
| public abstract | {PieSet.update-layout}:void |
Update the internal layout of this PieSet.
inner-radius: The inner radius of this PieSet.
outer-radius: The outer radius of this PieSet.
total-radius: The total radius all PieSets.
Description
This is called from
PieChart.update-layout.
PieSet implementations use this method to regenerate their
Shapes. If you are subclassing
PieSet, you will need to override this method to produce whatever
Shapes you want to represent your data and add them to the pie set using
PieSet.add.